
Toledo Bend Reservoir Water Temperature & Level Today
Live surface water temp (78.8°F), pool elevation (171.52 ft MSL), dam outflow, and 30-day hydrological history.
What Today's Conditions (78.8°F • 171.5 ft) Mean
Boat Ramps & Navigation
At 171.5 ft MSL, main public concrete ramps remain fully functional with sufficient trailer draft. Boaters should exercise standard vigilance around shallow sandbars when straying outside marked navigation channels.
Private Docks & Shorelines
Water line is situated 0.5 ft below normal conservation pool. Floating docks and gangways are operating at optimal gangway slope without mud grounding.
Water Temperature & Recreation
Surface water temperature of 78.8°F provides comfortable conditions for swimming, paddleboarding, and wakeboarding without thermal protection. Safety status is currently rated WATCH.
Spaceborne Satellite Observation & Water Clarity
Fresh multi-spectral overhead Earth observation from the European Space Agency (ESA) Sentinel-2 constellation (10m spatial resolution).
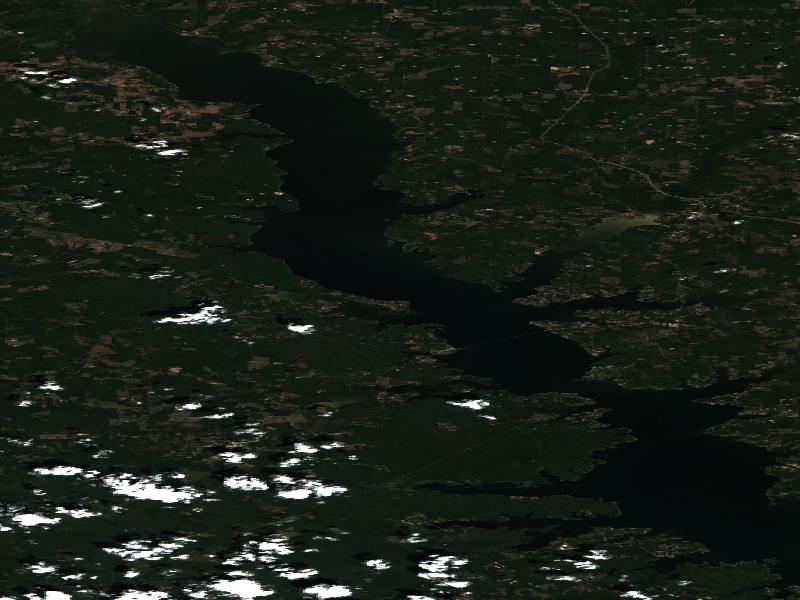
Satellite imagery and indices processed via Copernicus Data Space Ecosystem (CDSE) / Sentinel Hub API. Data reflects actual surface conditions at the time of orbital passage.
Derived from Band 4 red reflectance across open water pixels. Low reflectance indicates minimal suspended silt and high underwater visibility for angling and navigation.
Normalized Difference Chlorophyll Index (NDCI: 0.080) measures phytoplankton concentration using Red-Edge (B05) and Red (B04) bands to detect early bloom development before surface scums appear.
Normalized Difference Water Index (NDWI) contrasts Green and Near-Infrared spectra to map shallow shoals, sandbars, and exposed islands (like Sometimes Island on Travis or Wood Island on Texoma).
Reservoir Pool Benchmarks & Historical Records
| Pool Benchmark | Elevation (ft MSL) | Difference from Current | Notes / Historical Significance |
|---|---|---|---|
| Current Level (Today) | 171.52 ft | — | Live observation from Sabine River Authority |
| Normal Conservation Pool | 172.00 ft | -0.48 ft | Target design storage pool for recreation & water supply |
| Flood Control Pool (Top of Gates) | 173.00 ft | 1.48 ft remaining capacity | Water above this stage triggers emergency spillway discharge |
| Record Historical High | 174.36 ft | 2.84 ft above current | Recorded on 2016-03-10 |
| Record Historical Low | 161.42 ft | 10.10 ft above record | Recorded on 2011-10-18 |
30-Day Daily Water Level History
Official daily snapshots from Sabine River Authority
| Date | Elevation (ft MSL) | Daily Change | Inflow (cfs) | Release / Outflow (cfs) | Water Temp |
|---|---|---|---|---|---|
| 2026-09-18 | 171.52 ft | -0.01 ft | 880 | 967 | 79.1°F |
| 2026-09-17 | 171.53 ft | +0.01 ft | 810 | 909 | 79°F |
| 2026-09-16 | 171.52 ft | -0.01 ft | 864 | 844 | 78.6°F |
| 2026-09-15 | 171.53 ft | -0.03 ft | 734 | 944 | 78.6°F |
| 2026-09-14 | 171.56 ft | -0.01 ft | 704 | 890 | 79°F |
| 2026-09-13 | 171.57 ft | +0.03 ft | 925 | 894 | 78.9°F |
| 2026-09-12 | 171.54 ft | +0.02 ft | 788 | 891 | 78°F |
| 2026-09-11 | 171.52 ft | -0.03 ft | 834 | 919 | 77.3°F |
| 2026-09-10 | 171.55 ft | -0.07 ft | 692 | 906 | 77.8°F |
| 2026-09-09 | 171.62 ft | -0.04 ft | 789 | 845 | 78.9°F |
| 2026-09-08 | 171.66 ft | +0.01 ft | 931 | 974 | 79.4°F |
| 2026-09-07 | 171.65 ft | +0.02 ft | 748 | 871 | 79°F |
| 2026-09-06 | 171.63 ft | -0.01 ft | 807 | 840 | 78.4°F |
| 2026-09-05 | 171.64 ft | -0.03 ft | 693 | 1,017 | 78.5°F |
| 2026-09-04 | 171.67 ft | 0.00 ft | 876 | 814 | 78.8°F |
| 2026-09-03 | 171.67 ft | +0.03 ft | 888 | 880 | 78.4°F |
| 2026-09-02 | 171.64 ft | -0.01 ft | 710 | 1,016 | 77.7°F |
| 2026-09-01 | 171.65 ft | -0.05 ft | 800 | 774 | 77.5°F |
| 2026-08-31 | 171.70 ft | -0.07 ft | 729 | 938 | 78.4°F |
| 2026-08-30 | 171.77 ft | -0.01 ft | 931 | 972 | 79.4°F |
| 2026-08-29 | 171.78 ft | +0.03 ft | 808 | 780 | 79.5°F |
| 2026-08-28 | 171.75 ft | +0.02 ft | 698 | 973 | 78.7°F |
| 2026-08-27 | 171.73 ft | -0.03 ft | 817 | 916 | 78.1°F |
| 2026-08-26 | 171.76 ft | -0.02 ft | 776 | 826 | 78.3°F |
| 2026-08-25 | 171.78 ft | +0.01 ft | 938 | 962 | 78.6°F |
| 2026-08-24 | 171.77 ft | +0.01 ft | 720 | 886 | 78.2°F |
| 2026-08-23 | 171.76 ft | -0.03 ft | 727 | 880 | 77.7°F |
| 2026-08-22 | 171.79 ft | -0.06 ft | 845 | 913 | 78°F |
| 2026-08-21 | 171.85 ft | -0.05 ft | 811 | 903 | 79.1°F |
| 2026-08-20 | 171.90 ft | +0.02 ft | 899 | 904 | 79.7°F |
| 2026-08-19 | 171.88 ft | — | 658 | 862 | 79.2°F |
Get Toledo Bend Reservoir Water Level Alerts
Never get caught off guard by rapid reservoir rises, dock-grounding low water, or dam spillway releases.